Update: I think perhaps I was not clear enough when originally writing this that ethnicity/admixture is only an estimate or interpretation of your DNA, it is NOT an exact science and different interpretations often yield wildly different results. It's usually accurate on a continental level, but sub-continental regions generally share too much DNA to always be able to reliably tell them apart. That is why most of Gedmatch's calculators often cover broad areas. The more specific an area is narrowed down too, the more speculative the results are. Plus, different sample groups and different algorithms will always produce different results and there is no one option that is always going to be more reliable than any other. While the ethnicity reports can be fun and interesting to explore, which is why I wrote this guide, they really should not be taken literally. You should not attempt to use them to definitively prove your ethnic origins (on a sub-continental level), or exact amounts of any given ethnic origin, or a specific geographic path your ancestors might have taken over time, or especially to confirm a specific ancestor's identity. If that is what you're looking to do (particularly the latter), you are better off working with you DNA matches (if you have not opted into matching, you should seriously consider it, since that is where the true value of the test lies). Additionally, be aware that Gedmatch's admixture calculators haven't been updated in years (though all of this still applies to other companies who have provided updates more recently). With all that in mind, I hope this guide is useful to helping people understand the different interpretations of their DNA available on Gedmatch. Have fun, but remember, don't take it too seriously.
For those unaware, Gedmatch.com is a website where you can upload your raw DNA data for further analysis and matching with people from other companies who have also upload their data.
Parts 3 and 4 on Admixture Proportions by Chromosome and Chromosome Painting now available.
Part 5 on Spreadsheets is now available.
Part 1 - Admixture Proportions
Introduction
 Despite all the help articles available on Gedmatch.com, none of them really offer a comprehensive guide to understanding the admixture calculators for newbies. Most of them are guides on understanding DNA in general, or how to upload your data, or using the one-to-many or one-to-one tools. In fact, there is a very good beginners guide to the matching side of things found here. But the most common questions I see about Gedmatch are “which admixture calculator do I use?” and “what do the results mean?” There is a Gedmatch wiki page on admixture, and there is Kitty Cooper's slide presentation, but I don’t think they really answer all the questions most people are looking for, especially regarding Oracle. Even Googling the topic only turns up spotty results from forums and blogs, nothing that really lays it all out. Since no one else has done it, here is my attempt. Please keep in mind I am no expert and have no formal education in genetics, this is just the knowledge I’ve gathered over the years from various sources as a result of trying to understand my own DNA results.
Admixture is a scientific term for the ethnicity percentages you received from a DNA company like Ancestry.com, FamilyTreeDNA, 23andMe, or MyHeritage. It’s important to understand that each admixture project on Gedmatch is created by a different person, mostly academics. Note that most of the admixture results will include some basic info on the calculator, either on the results page, or through a link from the creator. However, the info provided may still be technical and difficult to understand for the average person, because they were primarily created for academic purposes. This is an attempt to translate some of that info into something more understandable to the average user. I apologize that this guide favors info on European backgrounds, but that is simply what I’m most familiar with, being a European descendant myself.
Be aware that it’s common practice in DNA admixtures to refer to populations from prehistoric times as “ancient”, even though this is a bit of a misnomer. In historical terms, ancient history marks the beginning of recorded history, but here, “ancient” generally refers to the time before written history, prehistory. Some time periods might be specified as “neolithic”, or “paleo/paleolithic” etc.
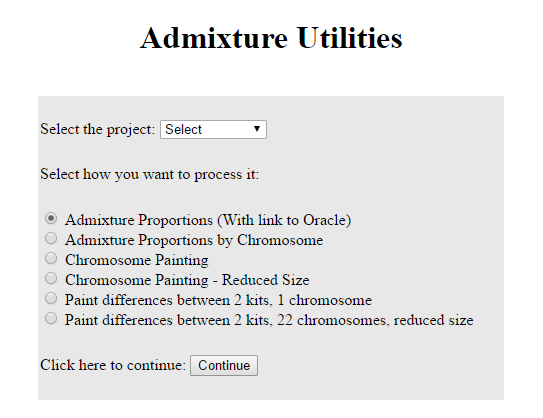 |
| Select a project from the drop down menu, leaving the other options as they are, then click "continue" |
There are 7 projects to choose from in the Admixture (Heritage) tool (found under "Analyze your data" and "DNA raw data"), but what are they? What do they mean? Which one should you pick? Here’s a basic breakdown:
(Note: below the projects drop down menu there are options like "Admixture Proportions (with link to Oracle)" and "Chromosome Painting", etc. Don't mess with those for now, just stick with the top default option, Admixture Proportions (with link to Oracle), as that is what this guide will cover.)
- MDLP
This is a global calculator and attempts to break your results down into different parts of the world. It’s good as an overview, but if, for example, you already know you’re European, it’s probably unnecessary. It’s also heavy on ancient groups. The blog for this project is found here: http://magnusducatus.blogspot.com/
- Eurogenes
As the name suggests, this is primarily for people with European backgrounds. While it does have populations outside Europe, there are usually more sub-continental regions for Europe than any other continent. I highly recommend this as the go-to project for people with sole European ancestry. The blog for this project is found here: http://bga101.blogspot.com.au/
- Dodecad
This project says it focuses primarily on Eurasians, but most of the calculators are geared more towards Asian and African ancestry than European. It’s not ideal for Europeans, but may be useful for people with mixed ancestry. The blog for this project can be found here: http://dodecad.blogspot.com/
- HarappaWorld
This calculator is primarily for people with South Asian ancestry. The blog for this project can be found here: http://www.harappadna.org/
- Ethiohelix
This is an African based project, though it does have options for people with mixed backgrounds (but always including African). There is no Native American in this project at all. The blog for this project is found here: http://ethiohelix.blogspot.com/
- puntDNAL
This is primarily a project on ancient DNA. There is no website, but questions and comments about should be directed to Abdullahi Warsame at puntdnalking@gmail.com
- GedrosiaDNA
This project focuses primarily Eurasian (especially Indian and Asian) and ancient DNA. There is no website, but for further questions, please contact the creator at Dilawerkh4@gmail.com
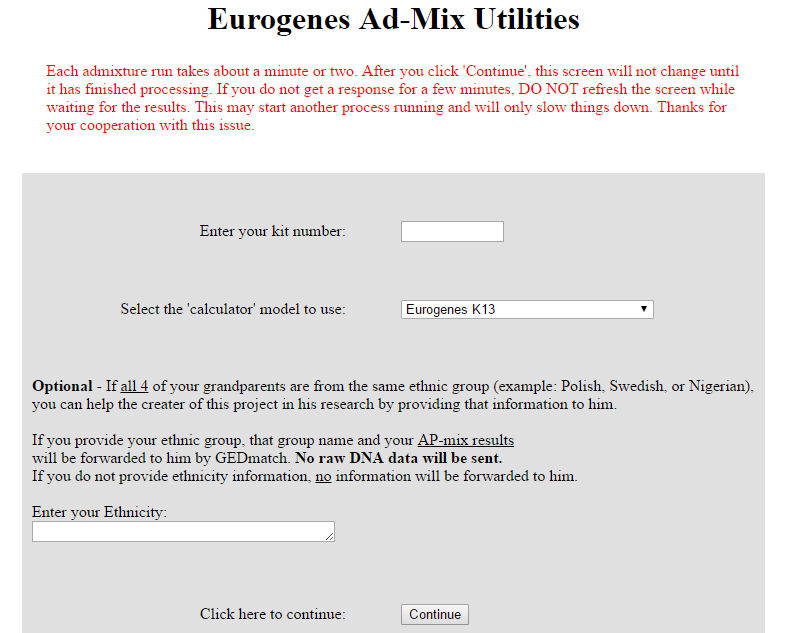 |
| Once you've selected a project, you need to enter your kit number and then select a specific calculator. |
You’ll find that for each project, there are often several calculators to choose from. How to choose? What do they mean? What are the differences? Well, for starters, the numbers following a ‘K’ indicate how many populations (or regions/categories) that calculator includes. So for example, Eurogenes EUtest V2 K15 has 15 populations. So choose one depending on how many regions you want to break your results down into. Keep in mind the more populations and therefore the more specific the regions are, the more speculative the results will be.
Don't forget to put in your kit number - if you've forgotten it, go back to the home page and copy it.
Certain other tests may be specific to deeper, more ancient (prehistoric) ancestry, like Hunter-Gatherer vs Farmer. Any abbreviation that starts with ‘A’ probably stands for ‘ancient’, but I will post a comprehensive terminology list at the end of this guide. These calculators for ancient DNA aren’t very useful if you’re just looking for an opinion on your more recent ethnicity results.
Other calculators might be specific to certain types of ancestry. For example, Eurogenes’ Jtest is specific to Ashkenazi Jewish ancestry. There’s no need to run this test if you don’t have any Jewish ancestry. In fact, you might get false results in Ashkenazi if you run this calculator and have no Jewish ancestry.
(Note: ignore the option below the calculator drop down menu, this is for data collection purposes. If all 4 of your grandparents are from the same ethnic group and you want your DNA to be a part of the sample groups they use to create these calculators and determine populations, then go ahead and fill it out. Otherwise, you can ignore it.)
Here’s a more detailed breakdown of each calculator. I've also created a spreadsheet listing the populations included for each calculator, along with my recommendations for good calculators to use based on your ancestry or what you're looking for.
MDLP
- MDLP K11 Modern - 11 global populations including ancient
- MDLP K16 Modern - 16 global populations including ancient and modern - results page includes full population descriptions
- MDLP K23b - 23 global populations including ancient
- MDLP World22 - 22 global populations including ancient, full details including maps of what areas each category covers are found here - there are several Native American categories so this may be ideal for Native American ancestry
- MDLP World - 12 global populations, probably the original MDLP calculator
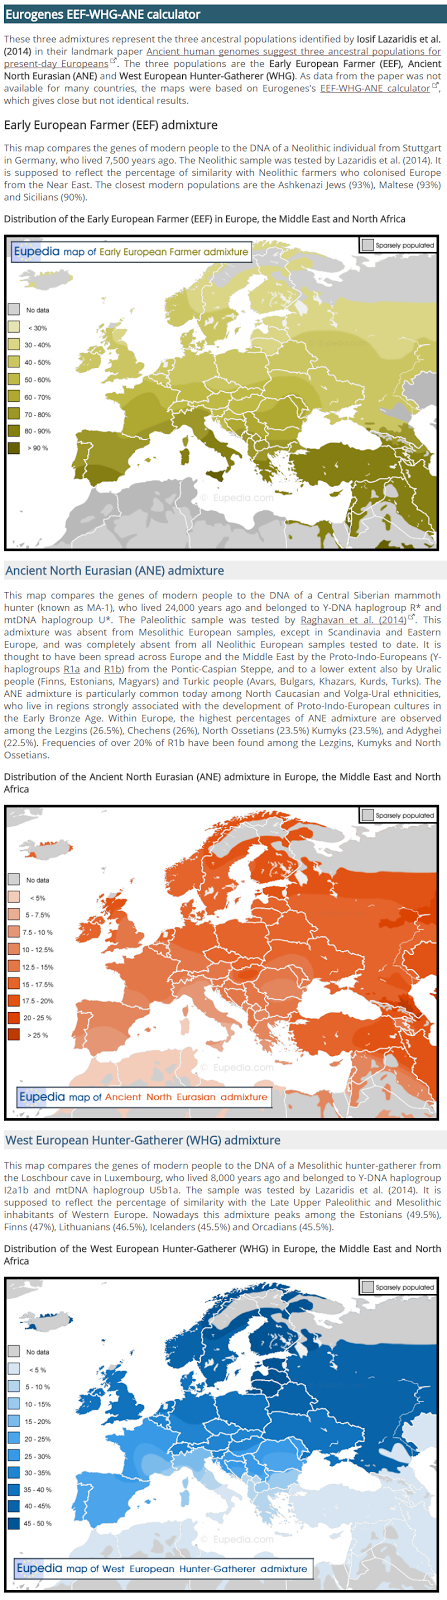 |
| Some Population Maps for Eurogenes ANE |
- Eurogenes K13 - 13 global populations, mostly European. Creator made this the default as it “seems to hit the spot for most people” with European background. Details here
- Eurogenes EUtest V2 K15 - 15 global populations, mostly European, also a popular option. Details including regional maps for each category found here
- Eurogenes ANE K7 - 7 populations, Ancient North Eurasian, meaning this looks at ancient DNA mostly in Europe, Western Asia, and Africa. Details found here and some maps available here
- Eurogenes K9b - 9 global populations, approximates Geno 2.0 analysis
- Eurogenes K9 - 9 global populations, map available here (population descriptions no longer available)
- Eurogenes K10 - 10 global populations, map available here (population descriptions no longer available)
- Eurogenes K11 - 11 global populations, map available here (population descriptions no longer available)
Eurogenes K12 - 12 global populations. North European ancestry is said to do well with this calculator. Map available here (population descriptions no longer available)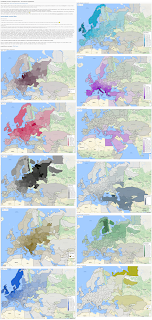
Some population maps
for Eurogenes K36- Eurogenes K12b - 12 global populations, excluding Native American (Amerindian), map available here (population descriptions no longer available)
- Eurogenes K36 - 36 global populations, mostly European. This is the most detailed breakdown for Europeans, but that also makes it highly speculative. Details found here and maps available here - there's also an interesting application that will map out your personal K36 results
- Eurogenes Hunter-Gatherer vs Farmer - 12 ancient Hunter-Gatherer vs Farmer populations. Map available here
- Jtest - Jewish Ashkenazi, 14 global populations but mostly European, this is essentially the EUtest with an Ashkenazi category. Details including maps are here
- EUtest - 13 global populations, mostly European minus Jewish Ashkenazi. Details including maps are here
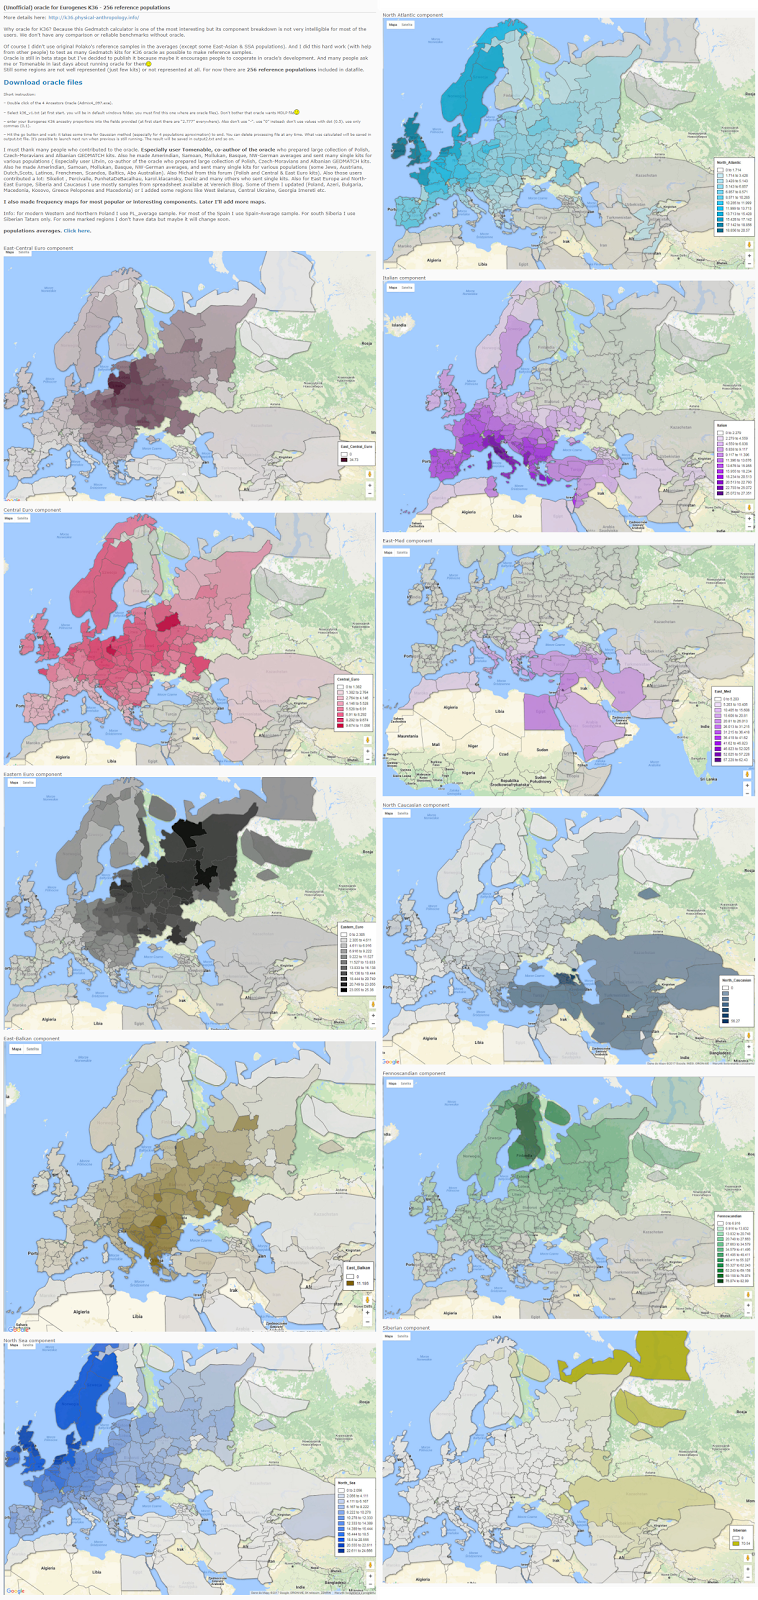
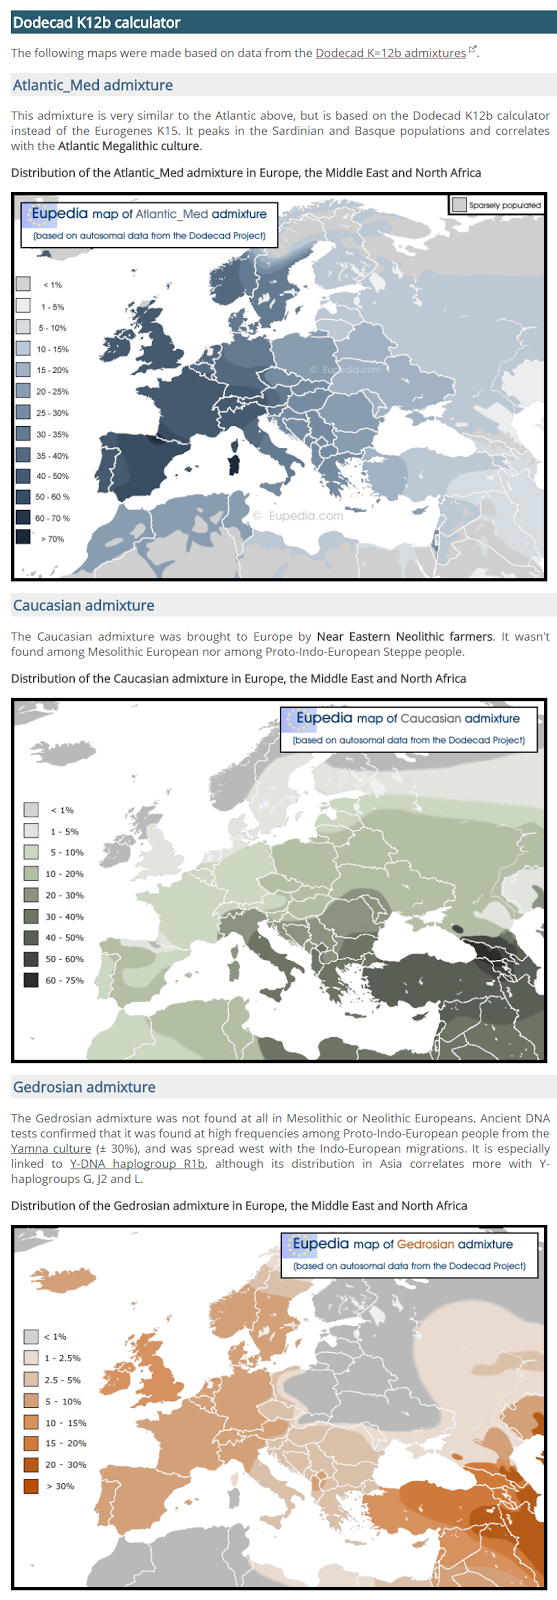 |
| Some Dodecad K12b Population Maps |
Dodecad
- Dodecad V3 - 12 populations, mostly Asian and African, 2 European, no Native American. More info
- Africa9 - 9 populations, all African except one European (no Asian, no Native American). More info
- World9 - 9 global populations, not specific to any continent so good as an overview regardless of your ancestry. More info
- Dodecad K7b - 7 populations, mostly Asian, 2 European, 1 African, no Native American. More info
- Dodecad K12b - 12 populations, mostly Asian, 3 African, 2 Middle East, 2 European, no Native American. More info and population maps
HarappaWorld
- HarappaWorld only has one calculator and as explained above, it’s primarily for South Asian ancestry. It does include some European, African, and Native American populations, but its focus is on South Asian: Indians, Pakistanis, Bangladeshis and Sri Lankans.
Ethiohelix
- EthioHelix K10 + French - 10 populations, 9 African, one “French” which acts as a European population. This is really only useful/accurate for people with mixed African and European ancestry. Maps available here
- EthioHelix K10 + Japanese - 10 populations, 9 African, one “Japanese” which acts as an Asian population. Only useful for people with a mix of African and Asian ancestry. Maps
- EthioHelix K10 + Palestinian - 10 populations, 9 African, one “Palestinian” which acts as a Middle Eastern population. Only useful for people with a mix of African and Middle Eastern ancestry. Maps
- EthioHelix K10 Africa Only - 10 strictly African populations, nothing else. Do not use if you have no African ancestry as results won’t be accurate. Maps
puntDNAL
- puntDNAL K10 Ancient - 10 ancient populations, incorporates Caucasus HG as well as Early Neolithic Farmers and Western European HG.
- puntDNAL K12 Ancient - 12 populations, utilizing ancient oracle, more info provided on results page
- puntDNAL K12 Modern - 12 populations utilizing modern oracle, more info provided on results page
- puntDNAL K13 Global - 13 modern populations, focuses primarily on Asia (6 Asian populations, 3 African, 2 European, 1 Oceania, 1 Native American). From the creator: "The impetus in creating this calculator was the release of the Southeast Asian study, which inspired me to create a calculator that included a Southeast Asian component and give my Southeast and Northeast asian people a more accurate calculator for their ancestry." Population details
- puntDNAL K15 - 15 populations, focuses primarily on Africa (particularly East Africa), but also includes some West Asia, and Europe. More info
- puntDNAL K8 African only - 8 populations, as the name suggest, it’s strictly an African calculator
GedrosiaDNA
(Removed) Eurasia K9 ASI - 9 populations, modeled around the ancient Ancestral South Indian component, no Native American. More info on population descriptions(Removed) Eurasia K10 CHG - 10 ancient populations, modeled on Caucuses Hunter Gatherers, more info on population descriptions(Removed) Eurasia K11 CHG-NAF - 11 ancient populations, modeled on Caucuses Hunter Gatherers and Neolithic Anatolian Farmers, more info on population descriptions- Gedrosia K3 - 3 populations, Eastern Eurasian, Western Eurasian, and Sub-Saharan African. More details
(Removed) Gedrosia K15 - 15 populations with a focus on the Indian subcontinent. Population descriptions(Removed) Eurasia K14 - 14 populations, using the same Neolithic and Bronze Age source data as the K14 Neolithic calculator, plus some modern populations(Removed) Eurasia K14 Neolithic - 14 global populations, focus is on ancient Neolithic and Bronze Age genomes from across Eurasia. Population descriptions- Gedrosia K12 - 12 populations, designed for individuals of predominantly South Asian and West Asian ancestry for inferring gedrosian Balochi admixture. No Native American. More info
(Removed) Gedrosia K11 - 11 populations with a focus on Kalash Indo European peoples of Pakistan. Population descriptions- Ancient Eurasia K6 - 6 ancient populations, primarily Europe, Asia, and in between, 1 African, no Native American. Further descriptions are available on results page.
(Removed) Near East Neolithic K13 - 13 ancient populations, with a focus on the Near East. Details provided on results page.
Step 3: Understanding the results: A Terminology Guide
A list of populations you might see and a brief description. I did not include some of the most self-explanatory ones. Some that I have listed might still be obvious to some people, but I’ve seen others ask about them on occasion. If there isn’t one listed here, you might learn a lot by just googling it. There is also a good abbreviation guide here: https://isogg.org/wiki/Abbreviations
Keep in mind different calculators may use different terms to refer to the same region or population.
Keep in mind different calculators may use different terms to refer to the same region or population.
- Amerindian or Amerind - Native American (ie, American Indian meshed into one word)
- Anatolian - mostly Turkey
- Ancestral Altaic - Asia (excluding South), and Eastern Europe
- ANE - Ancient North Eurasian
- Archaic African - broad category for prehistoric Africans
- Archaic Human - broad category for prehistoric humans around 500,000 years ago
- ASE - Ancient/Ancestral South Eurasian
- Ashkenazi - Ashkenazi Jewish of central/eastern Europe (not the same as Sephardic Jewish)
- ASI - Ancient/Ancestral South Indian
- Australian - aboriginals of Australia
- Australoid - “people indigenous to Southeast Asia, South Asia, Australia, Melanesia, Polynesia, Micronesia, and historically parts of East Asia.” (Wikipedia)
- Austronesian - “relating to or denoting a family of languages spoken in an area extending from Madagascar in the west to the Pacific islands in the east.” (Google)
- Baloch - people of Iranian Plateau and Arabian Peninsula (primarily the Middle East)
- Baltic - regions surrounding the Baltic sea
- Bantu - Central and south Africa
- Basal - Basal Eurasian?
- Beringian - areas surround the Bering Strait (Eastern Russia and Alaska)
- Biaka - aka Aka, “nomadic Mbenga pygmy people who live in southwestern Central African Republic and the Brazzaville region of the Republic of the Congo” (Wikipedia)
- Caucasian/Caucasus - people of the Caucasus region, the border between Europe and Asia in between the Black sea and the Caspian Sea
- CHG - Caucasus Hunter Gatherers
- EHG - Eastern Hunter-Gatherer
- ENF - Early Neolithic Farmer
- Fennoscandian - Scandinavia and Finland
- Gedrosia - Modern day Makran (semi-desert coastal strip in Balochistan, in Pakistan and Iran, along the coast of the Persian Gulf and the Gulf of Oman)
- Khoisan - Southern Africa
- Mbuti - “one of several indigenous pygmy groups in the Congo region of Africa” (Wikipedia)
- Melanesian - “a subregion of Oceania (and occasionally Australasia) extending from the western end of the Pacific Ocean to the Arafura Sea, and eastward to Fiji.” (Wikipedia)
- Mesoamerican - Native American in Mexico, Central and South America
- NAF - Neolithic Anatolian Farmer
- Oceanian - Aboriginals of the Pacific Ocean islands (may include Australia depending on calculator)
- Omotic - Southwest Ethiopia
- Papuan - New Guinea and surrounding islands
- Pastoralist - Sheep or cattle farmer
- Pygmy - “certain peoples of very short stature in equatorial Africa and parts of Southeast Asia.” (Google)
- San - Bushmen of southern Africa
- SEA - South East Asian
- SSA - Sub-Saharan African
- Steppe - “ancient North Eurasian hunter-gatherers' heritage, which was subsequently shown to have an influence in later eastern hunter-gatherers and to have spread into Europe via an incursion of Steppe herders” (MDLP K16)
- Tungus-Altaic - Northeast China and Siberia
- WHG - Western Hunter-Gatherer
- WHG-UHG - Western Hunter-Gatherer/Unknown Hunter-Gatherer
- Volga-Ural - Part of Russia (central)
Conclusion
Which project and calculator you go with greatly depends on your known ancestry. I know all this info is probably still a little overwhelming even with (or perhaps because of!) this guide. If you’re of European descent, and a newcomer to Gedmatch, and you just want a second opinion on your ethnicity results from any of the Big 3 companies (Big 4 now maybe, with MyHeritage joining the bandwagon), I’d recommend Eurogenes K13 or K15. Personally, I tend to prefer K15, because there are maps available showing specifically what regions are covered by which populations. Certainly, you can play around with any of the other Eurogenes calculators too (except Jtest if you’re not Jewish). Most of the other projects and calculators are either geared more towards ancient DNA, other continents, or a mixed ancestry. You may find a non-bias global calculator in some of the other projects, but it’s probably not going to provide the breakdown of Europe you’re looking for.
If you’re looking for an ancient calculator, I again tend to stick to one of Eurogenes’ (HG vs F, or ANE), but MDLP have some good options too. There’s also a couple in puntDNAL which I don’t think have a bias towards any one type of ancestry.
If you’re African, Asian, or of mixed heritage, there are a number of options to choose from, but I unfortunately can’t recommend any over any others. Most global calculators will include Amerindian (I have noted when one doesn’t), but MDLP World22 seems to have the most categories for Native Americans and may be ideal for that.
I was surprised to realize Eurogene's Jtest is the only one that offers an Ashkenazi (or other Jewish) category, so if you're Jewish, it looks like this is your only option. However, it should be noted that there are many Jewish populations typically included in Oracle/Oracle 4 (see below for more details), not just for Jtest but any other given calculator too. For your reference, I created a spreadsheet that shows which calculators have what Jewish populations available in Oracle/Oracle4.
If you're adopted and don't know what your ethnic background is, is important to remember that there's never going to be one defining ethnicity or admixture report that tells you "this is your ancestry" with any total accuracy. However, I understand the desire to know where you came from, so what I'd recommend is gathering as many reports as you can (within reason - if you're obviously white, there's no sense running an African-only calculator) and compare them in a spreadsheet like I've done here. It will help you spot any consistencies, or see what populations show up most frequently in the highest numbers.
It is frustrating that maps, or at least population descriptions, aren’t available for every calculator, but this is a free service, after all. It’s actually pretty amazing all the work the project creators do to provide this for free.
Part 2 - Oracle
 |
| Say what now? |
Introduction
The second most common questions I see about Gedmatch are about Oracle. What is it? What do the results means? Oracle is an attempt to pinpoint your origins to a more specific population or region. You'll find many are narrowed down as specifically as regions within countries, or specific religious groups. There are two options: Oracle and Oracle 4. You will find buttons for them listed under your admixture results. Note that not all admixture calculators have Oracle available so pick a calculator that both suits your background and offers Oracle. There is a third button which just says "Spreadsheet" but this is covered this later. There is a also good explanation for this from Roots & Recombinant DNA.
Oracle
Oracle will list your admixture results, then something called Single Population sharing, and finally Mixed Mode Population Sharing.
- Single Population Sharing attempts to pinpoint a specific, single population that your DNA most closely matches, with a list of the top 20. The distance will tell you how closely you match each group, so the smaller the distance number is, the more closely you match. It is assuming your ancestors all came from the same area/population (so if they didn't, this is probably not ideal for you and the results may not make sense).
- Mixed Mode Population Sharing will show you your top 20 of two specific, combined populations in order of how closely you match those populations. It is assuming your ancestors came from only two locations/populations (though not necessarily split 50/50). Again, the distance will tell you how closely you match this combo of populations, while the percentage will tell you how much of your DNA matched which population.
Oracle 4
Oracle 4 is essentially the same as Oracle, except it expands on it by providing combinations of 3 and 4 specific populations. The single and double combinations can be different from original Oracle though, so don’t bypass Oracle thinking you’ll get that and more with Oracle 4, it may be best to examine both depending on your ancestry.
- Using 1 population approximation works the same as Single Population Sharing in Oracle, but I’ve noticed the results are sometimes different, so they’re obviously using a slightly different calculation. Reading the results works the same though: they are showing you a list of specific populations you most closely match, with the distant showing you just how closely you match. Again, this is intended for people whose ancestors all come from the same population.
- Using 2 population approximation also works similarly to Mixed Mode Population Sharing but you'll notice that the percentages are always 50/50. That's because it's assuming that you have one parent from one population, and the other from another, so you would be 50/50. If that's not the case, this is not ideal for you. For some reason this only lists your top 1 result instead of the top 20. Again, the distance tells you how closely you matched this combo of populations.
- Using 3 population approximation works the same as 2, but with a combination of 3 populations instead. So it's assuming you have one parent from one population and on your other side, you have a grandparent from a different population, and the other grandparent from a third population. This is why one population will be 50%, and the other two are 25%. It only lists one result. You know what the distance means by now.
- Using 4 population approximation uses a combination of 4 specific populations you most closely match and lists your top 20 combos. This was designed for people who have 4 grandparents from 4 different places but it can sometimes also work well if most of your ancestry is mainly from 4 different places/populations (because it does not include percentages).
Conclusion
Be aware that the results from Oracle and Oracle 4 will vary depending on what admixture calculator you used, which is why they are found on the admixture results page, and not as a separate calculator. Also keep in mind the results are speculative, but I have found they do often make some sense, and in some cases, can be remarkably accurate. Check out my blog post on a deeper analysis of my Oracle results here. However, if you do not fit the scenarios described of having parents or grandparents from one location, the results may not be reliable for you.
A lot of ancient populations in Oracle will likely have unfamiliar names but there's a good a map showing where many of the samples for the ancient populations came from available here.
If you feel like you've got a good handle on this, continue onto Parts 3 and 4, Admixture Proportions by Chromsome and Chromosome Painting.
Excellent information. Thank you!
ReplyDeleteThis is really useful and needed. Thank you! Great work.
ReplyDeleteI have always found Gedmatch's admixture very confusing. The information you have shared has cleared it up. Thank you for your excellent article.
ReplyDeleteThank you. Lots of information to filter. However, I'm so gratefully you shared this awesome knowledge.
ReplyDeleteGreat. Any info on chromosome painting?
ReplyDeleteI might do another guide on the other options by Admixture by chromosome and Chromosome painting if it seems like there's a demand for that.
DeleteI would love that, I cannot figure out how to read the chromosome paintings at all!!!
DeleteWonderful! Thanks so much!
DeleteVery useful! Thank you very much.
ReplyDeleteHello, your information is quite helpful. I was wondering, if you have a key for some of the place listed as 2 letter abbreviations when you look at the Oracles? I can guess on some and others leave wondering where they are referencing. Here are some examples that I just do not known: Hu, PT, ES, RO, and IE. Thanks for your information in the blog post.
ReplyDeleteThat's interesting, I don't think I've ever come across two letter abbreviations in Oracle - you must match some populations I don't. Which calculator are you using when you get these results?
DeleteI think I figured it out... It is European country abbreviations. Silly, I finally put the right key words into google https://mfi-assets.ecb.int/resultMfiD/abbreviations Thanks again for your information.
DeleteHugely helpful - thanks.
ReplyDeleteThis comment has been removed by a blog administrator.
ReplyDeleteExcellent article. Do you know what to do on the Oracle if the single population is totally different from the four population estimate? Do you pick the one with the lower number or the one that is a better fit to your known history? Also, I had several ZERO diatances. Is that good? Thank you for any help you can provide. I've been scouring the Internet.
ReplyDeleteZero distance from a population on Oracle would mean you matched that population exactly, so that's very good. I don't think there is ever a definitive answer though, since this is all very speculative data. I would take it all into consideration.
DeleteExcellent article. Do you know what to do on the Oracle if the single population is totally different from the four population estimate? Do you pick the one with the lower number or the one that is a better fit to your known history? Also, I had several ZERO diatances. Is that good? Thank you for any help you can provide. I've been scouring the Internet.
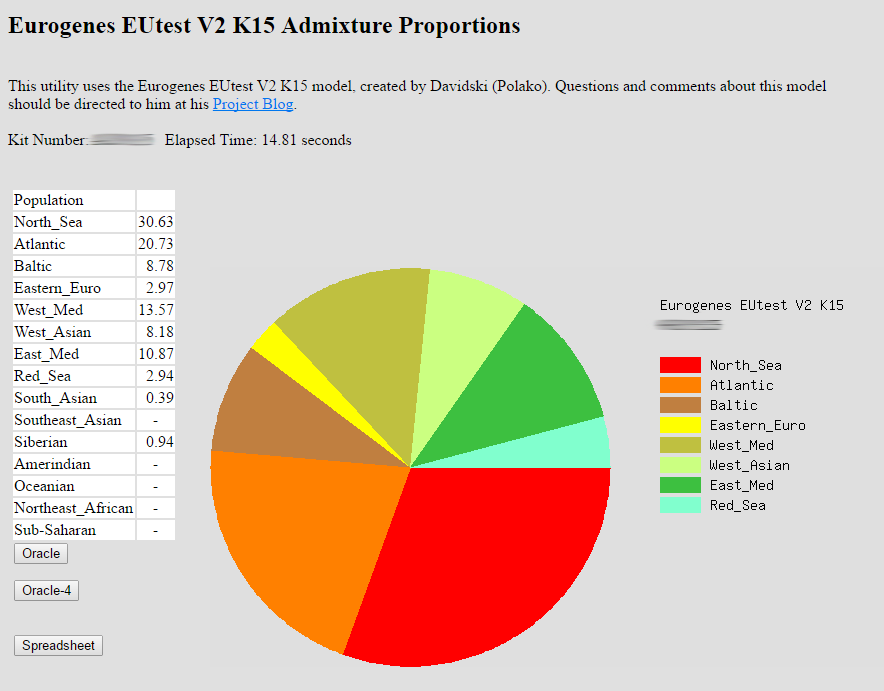
ReplyDeleteI think I'm probably just really stupid. I still don't exactly know how to read the results. I have an idea, but I don't like to assume anything. For example, what exactly does your first photo, the pie chart, say?
ReplyDeleteWhat do the spreadsheets mean? How do you read them?
The pie chart is just a visual of the percentages to the left. So it's saying I got 30.63% in the region labelled North Sea (areas that border the North Sea), 20.73% in Atlantic (European areas that border the Atlantic Ocean), 13.57% in Western Mediterranean and 10.87% in Eastern Mediterranean (those are my Italian ancestry), etc.
DeleteAs for spreadsheets, there is a good explanation here: http://www.rootsandrecombinantdna.com/2015/12/gedmatchs-new-spreadsheet-feature.html
Thanks for the explanation and link! It makes much more sense now.
DeleteI'm just trying to find out who I am. I know I'm American Indian but I don't know how much.
ReplyDeleteThank you so much! So helpful! I was looking at all this and not understanding. This helped so much!
ReplyDeleteThank you - that is so helpful. I'm new to this and have been utterly bewildered to date. That explains a lot.
ReplyDeleteThanks. It's very useful.
ReplyDeletethis is an amazing blog, thank you so much for making it clear and simple to understand!
ReplyDeleteYour blog clarifies it much more than Gedmatch. I know I'm mixed...very much but thr closest I have come to 0 is 2.5 with the 4 population mode.
ReplyDeleteThank you, this helps a lot.
ReplyDeleteThank you! This is so helpful.
ReplyDeleteMaybe I missed it, but is there a map for the Eurogenes K13 model?
ReplyDeleteUnfortunately not - there are some maps for K15 though, which has some similar populations you could probably apply to K13.
DeleteOMG, thank you, believe it or not you have actually made me understand!
ReplyDeleteExcellent! 👏🏻👏🏻👏🏻 Thank you for putting all this into context. I'd figured out much of this over time, however this is a perfect place to come to as a reference guide.
ReplyDeleteThank you so much for taking the time to write and publish this. It has been very helpful and appreciated!
ReplyDeleteThese calculators are so wishy-washy. Why would you believe any of them when they tell you different things on different calculators. I also find it hilarious how one person told me that the "SSA at 1%+ was only real in Southern Europeans and that 0.x% SSA for all other Europeans was just noise and to not count it". LOL. Agenda much. Looking at the K3 averages page SSA, even at tiny percentage shows up in Norwegians as an average in the averages section of the calculator..
ReplyDeleteSomething like 0.08. It's tiny but it's still there yet people insist that it's only legitimate when it comes to Southern Europeans.
All the calculators are certainly estimates and no ethnicity/admixture report should be taken literally. But it is still interesting to see the different reports and how they work.
DeleteI imagine the person talking about African results for Southern Europeans versus Northern Europeans was referring to the fact that many Southern European do get consistent trace amounts from Africa because that Mediterranean area is so mixed. I'm not so sure about SSA, but I have South Italian/Sicilian ancestry and I do frequently get trace amounts in North Africa and I know it's not uncommon among Italians/Mediterraneans (it's also common for Italians to get results in the Middle East/Caucasus). This person sounds like this is maybe what they were referring to, but perhaps misunderstood it slightly.
As for Gedrosia K3, it's a very limited calculator with only 3 populations, defined as follows:
1- E Eurasian - This component peaks in E & SE populations such as Ami, Nivkh, Dai, Han, and Ulchi, at about 100%, followed by Siberian & other Asian populations such as Nganasans, Tibetans, Subba, and Mongola.
2- W Eurasian - This component peaks in Neolithic European farmers such as Stuttgart, and LBK culture, as well as in most modern European populations at over 95%.
3- SSA (Sub-Saharan African) - This component peaks in Sub-Saharan African populations such as Yoruban, Esan, and Luhiya at over 97%.
It is probably not really an ideal calculator if you are of recent European descent and looking for a calculator that represents that.
This is so much fun!! I've gt some literature to read now. I'm not up on Human Population Genetics.
ReplyDeleteyou're a life saver. time saver. great job on tackling this subject, it is very helpful!
ReplyDeleteThank you! An excellent comprehesnive guide which the website lacks!
ReplyDeleteThank you this is excellent
ReplyDeleteThank you for creating this page. What a huge help in deciphering Gedmatch. Excellent!
ReplyDeleteThank you, this is very useful. I have a question though. When running Oracle you get, let's say, a distance of 4 what does that number represent: 4k years?
ReplyDeleteI don't believe the distance number represents any time period, I think it's just a scale - such as from 0 to 20 with 0 being the closest, and 20 being the furthest away. That's sort of an example because I'm not sure how high the distance number goes - highest I've seen is 15.99 for mine. The lower the number, the closer you matched the samples for that population.
DeleteGreat Blog, my father was adopted so I only know my mums ancestry which is English and Welsh. When I run the K13 model I get single South Dutch 5.26 and mixed 91.9 south west English & 8.1 Abhkasian total distance 1.76. With K15 model I am getting single South West English 5.33 and mixed South West English 92.40 & 8.3 Tabassaran total distance 3.65. For reference my kit number is M691240. I have no idea what this information is telling me, help!!!
ReplyDeleteWell, all admixture/ethnicity is fairly speculative and it's particularly difficult to determine maternal side from paternal just based on ethnicity alone. Abhkasian and Tabassaran are from the Caucasus area (above the Middle East: https://en.wikipedia.org/wiki/Caucasus ) If you're consistently seeing results in that area, there could be something to it.
DeleteYou are amazingly generous to spell the GEDmatch admixture out for the new, and even seasoned, DNA genealogists! Thank you. I just uploaded my sister's DNA from 23andme new V.5 to the GEDmatch's beta Genesis Admixture calculator and your guide was helpful.
ReplyDeleteExtremely helpful information History Chick. I have a couple of questions. You said you preferred Eurogenes K13 or K15. K15 because of the maps. Did you mean Eurogenes EUTEST V2 K15? Also, how does one access the maps. Thank you very much.
ReplyDeleteYep, that's the one - the population maps are available on the creator's blog, there should be a link to it above. Here it is: http://bga101.blogspot.com/2013/10/eurogenes-k15-now-at-gedmatch.html
DeleteGot it! Thank you so very much.
DeleteDon't know how to know if my earlier question was seen. Should perhaps have 'ticked', 'notify me.
ReplyDeleteI responded to your question above, you may need to click on "replies" below it - or try here: http://genealogical-musings.blogspot.com/2017/04/finally-gedmatch-admixture-guide.html?showComment=1504574025547#c8899410746532421922
DeleteThis was very helpful. They should link to your post on their site. :)
ReplyDeleteThanks! That would be nice, but it seems they might only add guides from professional geneticists.
DeleteI don't understand why K13 should be more accurate for people of European ancestry compared to the regular EUtest (not the new k15). Can you explain this ? Because it makes no sense to me. It would only make sense to me if , perhaps, the people using K13 were mostly Eastern European.
ReplyDeleteThat is what the creator of the project and calculators has said. Do you feel K13 is heavy weighted towards Eastern Europe? I haven't found that to be the case in my experience. It doesn't really have an Eastern Europe category to begin with - I think the regions are broader than that (I'm guessing Eastern Europe is within "Baltic" but that this covers more than just Eastern Europe - probably anything around the Baltic Sea). I don't know of any reason why K13 shouldn't be more accurate for most people - of course it depend on the individual, but I guess most people report that the particular algorithm for K13 works the best for them. Your mileage may vary, of course, but if you'd like more info on how the calculators work behind the scenes and why one might generally be more accurate than another, you would have to contact the project's creator.
DeleteFirst, how accurate are the Admixture Calculators? What are their Specificities, Sensitivities, Positive Predictive Values, Negative Predictive Values, and Confidence Intervals? I can't find these in GEDMatch.com. I can't take any of these calculators seriously without these values.
ReplyDeleteSecond, what does the "GED" stand for in GEDMatch?
You would probably have to contact each of the projects creators to get that kind of technical information. Or check their blogs - they might share that kind of thing on their blogs. If not, you would have to ask them.
DeleteHowever, all ethnicity or admixture reports are only ever going to be estimates, since people of neighboring regions share some DNA, making it not always possible to tell them apart with any real accuracy. I wouldn't take any ethnicity/admixture report very literally, it's just fun and interesting to explore. How accurate they will be depends on the individual - you will likely find some are more accurate for you than others and they probably won't be the same ones for everyone. Like I say, some are designed for people of certain ancestry so if you use one that's not ideal for your ancestry, it's probably not going to be very accurate.
I assume the GED in GEDmatch stands for the same thing that GED in "gedcom" stands for: Genealogical Data.
thank you for this!
ReplyDeleteAll of the tests mentioned above are interesting. But in each of them, they only mention Amerindian as an afterthought, if mentioned at all. I would hope someday someone would create a genetic test that was centered upon finding small amounts of American Indian genetic information. The few tests available that do look at it do so as an afterthought, and minimize its role.
ReplyDeleteUnfortunately that's probably because many Native Americans in the US are reluctant to participate in supplying samples. So working with small sample groups doesn't allow them to break it down further. The majority of the samples come from Latin America and Canada. That said, MyHeritageDNA attempts to break it down into 3 regions, and LivingDNA attempts 4. DNA Tribes has the most with 7 regions, but I honestly couldn't say how reliable they are: http://dnatribes.com/populations.php - also note how there's no category that covers the eastern US. That's because tribes in the east were largely pushed west and forced to integrate with western tribes, which creates another problem in finding full blooded tribal members that aren't a mixture of different tribes.
Delete
DeleteI used My Heritage as a means to cheaply get my raw DNA results.
I then went to Gedmatch , contacted Dr. Doug Mcdonald and additionally sent my raw DNA to DNA Tribes.
Those results all coalesced together perfectly and showed me all the stuff MyHeritage left out.
Showed my Native American, etc. My Heritage showed my NA as Eskimo only.
I have two Italian grandparents, one Portuguese grandparent and one Ashkenazi Jewish grandparent. My results have a lot of Italian and Jewish groups both Ashkenazi and Sephardi, but all of my results seem to have either Palestinian, Syrian, Druze, Lebanese or Samaritan...Do you know if this is common among any of the three populations I come from? I know Arabs were in Italy and that Jews are also related to Middle Eastern populations...Just trying to find out why these groups come up so much in my results.
ReplyDeleteIt's not unusual for Mediterraneans to get results in the Middle East too. I don't know much about Jewish DNA but Samaritans are Jewish so I assume what you're seeing is at least not unheard of.
Deletehi louie,i am also italian and greek and getting lots of jewish popping up.like you i am getting druze,samaritan and palistine.what i dont understand is some of these percentages.i am wondering which side my jewish is on.my sister is also coming up with jewish also.
DeleteI am Filipino and I found the Dodecad V3 the most useful calculator.
ReplyDeleteHi. Can you tell me (and a whole lot of others) what "Southern" stands for? We just can't figure it out. Thanks!
ReplyDeleteWhich calculator are you using? I do recall coming across that before, and I think I assumed it meant Southern Europe, but I can't be sure because I don't remember the calculator. If that doesn't seem right, I would try contacting the calculator's creator and asking.
DeleteOkay, I had a look and it seems like it's in some of the Dodecad calculators. Looking at K7b in particular, I definitely think it's supposed to be Southern Europe. The populations are:
DeleteSouth_Asian
West_Asian
Siberian
African
Southern
Atlantic_Baltic
East_Asian
They seem to be lumping all of Africa into one group, so that rules out Southern Africa. There's already a South Asia group, so it's not Southern Asia. The Atlantic-Baltic group is obviously Northern Europe, so it makes the most sense for this to be Southern Europe. Additionally, when I run this calculator, I get 22% in "Southern" which should only happen if it's meant to be Southern Europe since I am of European descent.
If you check out the spreadsheets I made here: https://docs.google.com/spreadsheets/d/e/2PACX-1vQyi9kkGOYOlKIKdoweLNTXNBXpYr_JpcBXUS5L2Yj-f5NE7GSoRJT-yRc-YWKbcK5XpmWH0Iv82Hcf/pubhtml# - click on "Jewish Populations in Oracle", you'll see that Oracle often include many different types of Jewish populations and which calculators to find them under. Many of them include Sephardic, and MDLP World and World-22 offer the most Jewish populations in total. Oracle won't give you a percentage but it will hopefully tell you how closely you match the population.
ReplyDeleteThanks for putting together this fantastic resource. My grandparents were all from China but one was from the extreme north (Inner Mongolia) and one from the far south (near Thailand). My father's side is from a province that had large populations of settlers from the Silk Road. I've gotten all sorts of wild results from the GEDMatch calculators and have no idea which one is accurate. Do you recommend any particular GEDMatch for East Asians?
ReplyDeleteI don't have much experience with East Asian results, unfortunately. I believe Dodecad V3, Dodecad K12b, and HarappaWorld have the most Asian categories in general and therefore would provide the most break down. For Oracle, there's a lot of options that include Chinese, Mongolian, and Thai - you can look through them here: https://docs.google.com/spreadsheets/d/e/2PACX-1vQyi9kkGOYOlKIKdoweLNTXNBXpYr_JpcBXUS5L2Yj-f5NE7GSoRJT-yRc-YWKbcK5XpmWH0Iv82Hcf/pubhtml (click the tab for Oracle Populations)
DeleteThanks, I'll check it out!
DeleteThank you SO much for this! I've always wondered why there were no explanations for these features on the site. This will be very helpful!
ReplyDeleteRenate
Can someone explain primary population source vs secondary population source? Below are my Mixed Mode population source.
ReplyDeletePopulation (source) Secondary Population (source) Distance
1 89.3% Argyll (1000 Genomes) + 10.7% N_Italian (Dodecad) @ 0.75
2 90.5% Argyll (1000 Genomes) + 9.5% North_Italian (HGDP) @ 0.77
3 92.5% Orkney (1000 Genomes) + 7.5% Greek (Dodecad) @ 0.82
4 91.7% Argyll (1000 Genomes) + 8.3% Tuscan (HGDP) @ 0.87
5 93.3% Orcadian (HGDP) + 6.7% Greek (Dodecad) @ 0.88
Primary is just the population more of your DNA matched - you may notice that all the ones listed under Primary Population have the higher percentage than the Secondary Population.
DeleteWhat does RISE mean
ReplyDeleteRISE seems to be related to ancient (prehistoric) populations - I'm not sure if it means much on it's own, I'd focus more on what the rest of the population name says.
DeleteYou may also be interested in this map showing the locations of many ancient DNA samples - if you expand number 5 (3000-2000 BC) there's a number of RISE samples: https://www.google.com/maps/d/viewer?mid=1TYJrkLXUap0Ip-8EIeTH-uzN4V8&hl=en_US&ll=47.8637807%2C21.000773900000013&z=8
DeleteFor example, in puntDNAL K12 Ancient oracle populations there's one called "BattleAxe Sweden SG RISE94" - looking at the map, the sample called "RISE94, Battle Axe, 2621-2472 BC" is in Sweden so I assume that population comes from this sample. The map shows exactly where this sample was found. Hope it helps!
You give an excellent overview. I have been using the various Gedmatch calculators with my 23andme raw data - and for me they are very accurate in matching my known with my ancestry shown on Gedmatch. Also with the ancient dna samples. Cheers!
ReplyDeleteSupercalifragilisticexpialidocious
ReplyDeleteand Thank YOU
Thank you thank you thank you for this! I was getting so confused and this really made a difference. Excellent article!
ReplyDeleteSomething is puzzling me - the mixed mode population sharing. Eurogenes K13 results show my 2 largest DNA groups as North Atlantic and Baltic, both of which must be old DNA as my known family history is Irish/Scottish/English. When Oracle breaks that down to Single Population Sharing, North Dutch is second on that list. But in Mixed Mode Population Sharing the list is headed by 12 entries for North Dutch each of which is paired with a different Indian tribe! Each of those tribes is in the 2% range relative to North Dutch and the distance in all cases is also in the 2 range. Some googling on my part has failed to find evidence of migration from India to Holland that goes back far enough in time to account for such a strange mix. Both Ancestry and GEDMatch give me very small percentages of South Asian DNA so that in itself is not a surprise but this multitude of Indian tribes popping up certainly is! Can you comment, please?
ReplyDeleteWell, if it's only showing up as 2% then it doesn't seem far off the trace amounts in South Asia you get from Ancestry and Gedmatch. North Atlantic is pretty normal for the British Isles, and the North Dutch results are probably related to that. This is where the Spreadsheet option comes in handy - if you look at it for Eurogenes K13, you'll see North Dutch peaks in North Atlantic and Baltic.
DeleteThanks for your reply. I'll check out that spreadsheet but my basic problem is that I don't understand the MMPS system, i.e. why you can get multiple entries for a single population group (e.g. 12 entries for North Dutch).
DeleteEach line is a different comparison. If you're getting North Dutch results in 12 out of 20 results, then you most commonly match that population for that calculator.
DeleteThank you so much !!! This has been so helpful. (I am in Colorado too... love it here). Thanks again!
ReplyDeleteThank you SO much!! I was totally lost and now it's all starting to make sense. You're absolutely marvellous!!!
ReplyDeleteThank you SO much. GEDmatch provides a wonderful service, but it's not at all user-friendly. Your blog provided exactly what I was looking for! =)
ReplyDeleteThank you very much! This is super helpful!
ReplyDeleteThank you for this informative post.
ReplyDeleteFinally!
ReplyDeleteHistory Chick, thank you so much for your fantastic analysis of these complex admixture calculators. This was very helpful to me since I'm half Western European and half East Asian. I noticed that the Oracle admixture components for 2 populations are accurate for me in most of the Gedmatch project calculators (I did not use the ones primarily for African and Jewish people). In my case, the 2 admixture Oracle calculations are all 50%-50% for a European and an Asian population, which is correct, and those populations are mostly accurate based on my personal knowledge of my ancestry.
ReplyDeleteI appreciate your descriptions of populations as well, because some of the projects'
descriptions are difficult to find.
This has made Gedmatch more meaningful and entertaining for me. Have a great day and year!
I truly appreciated your information! I am new to this field, and I am grateful for your help, "clearing the waters"!
ReplyDeleteSo if our parents came from more than 1 area...should we ignore single population results?
ReplyDeleteI would put less emphasis on the single populations in that case
DeleteThis is such a helpful guide - thank you!
ReplyDeleteThank you for this guide
ReplyDeleteGreat guide. Apparently I'm almost a lot jewish and I didn't know that!
ReplyDeletei wanted to leave my thanks as this is fantastic!
ReplyDeletei knew some (a tiny fraction, ok) of this from study and context but your detail and step-by-step instruction are excellent. you've filled in the (who are we kidding, considerable) gaps in my knowledge and certainly made many things easier for me to explain to family (as well as myself!).
i thank you. well done, madam
Thank you. I understood some of GEDmatch, but this made is much easier.
ReplyDeleteI WAS LOOKING FOR MY SEPHARDI ANCESTRY , I KNOW ABOUT MY EUROPEAN AND MY NATIVE AMERICAN , I ALSO KNOW I HAVE ROMANY AND ASHKENAZIM, I KNEW I HAD Ethiopian, AFTER ALL ITS NOT THAT UNCOMMON TO HAVE SOME IF YOU ARE JEWISH DESCENT , THIS HOW EVER CAME AS A SHOCKER ... Using 1 population approximation:
ReplyDelete1 libya @ 5.122687
2 algeria @ 11.349472
3 moroccans @ 14.559498
4 morocco-n @ 15.878050
5 egypt @ 17.278883
6 sahara-occ @ 18.907295
7 egyptans @ 18.984011
8 morocco-s @ 32.877785
9 mozabite @ 48.766399
10 EtA @ 50.349751
11 EtT @ 51.185246
12 ethiopian-jews @ 53.692173
13 EtT-P @ 55.483963
14 EtA-P @ 57.221401
15 EtO-P @ 60.408516
16 Afar @ 62.108208
17 fulani @ 63.851814
18 EtO @ 66.948189
19 EtS-P @ 71.330872
20 Wolayta @ 72.056549
THIS WAS THE FIRST RESULT # Population Percent
1 North-Africa 61.26
2 East-Africa2 37.72
EAST AFRICAN2..., 37%... REALLY ? COZ LOOK AT ME , DO NOT GET ME WRONG , I AM HAPPY TO HAVE AFRICAN DESCENT AFTER ALL MY EX HUSBAND WAS FULL WEST AFRICAN,BUT 37% THAT DOES NOT FEEL TRUE , THOUGH I GUESS IT DEPENDS ON HOW YOU VIEW MODERN DAY MAN , FOR SURE MOST ARABS WERE FROM NOMADIC AFRICANS AND THEY CAME FROM SUDAN AND ETHIOPIA AND NUBIA, AND FOR SURE I HAVE A FAIR MIX OF ARAB AND JEW , 37% JUST FEELS EXCESSIVE, I KNOW NATIVE WILL NOT SHOW , OR WHITE IF YOU DO AFRICA ONLY
Population
Nilo-Saharan -
East-Africa2 37.72
Mbuti-Pygmy -
East_Africa1 -
Khoi-San -
West_Africa -
Hadza 0.51
Biaka-Pygmy -
North-Africa 61.26
Omotic 0.51
THIS IS THE RESULT WHEN I REPLACED ALL AFRICAN WITH FRENCH ....
Using 1 population approximation:
1 egypt @ 16.424067
2 egyptans @ 20.249853
3 libya @ 31.802073
4 french @ 37.044640
5 algeria @ 48.975906
6 morocco-n @ 50.150467
7 moroccans @ 59.061802
8 EtA @ 59.273983
9 EtT @ 60.474674
10 ethiopian-jews @ 61.011948
11 EtT-P @ 63.732040
12 EtA-P @ 66.438377
13 Afar @ 67.916260
14 EtO-P @ 69.249031
15 morocco-s @ 70.789864
16 sahara-occ @ 73.348755
17 EtO @ 73.503235
18 EtS-P @ 79.134499
19 Somali @ 79.492973
20 Wolayta @ 80.075493
HHHHHHHHHHMMMMMMMM, VERY SIMILAR BUT I AM STILL SORTA AMAZED IT MAKES ME SO AFRICAN, I GUESS ITS THE CELT WASHING ME OUT LIKE STONE WASHED JEANS , LOL
TBH I THINK I LOOK MORE NATIVE AMERICAN THAN ANYTHING AND I AM PART, ALONG WITH INDIAN FROM INDIA, SIBERIAN , MONGOLIAN , TIBETAN,BURMESE, WELL ANYWAY THE ANCESTRAL RACES OF THE NATIVE ARE S.E ASIA ...SOOO, AND MOST OF THE ASIAN IS SMALL, SEE ANOTHER THING IS I AM 44% WHITE AND WELL 37% AFRICAN OF ANY KIND .... I THINK THIS IS WRONG
ReplyDeleteJita'ame, what calculator were you using when you got 37% East Africa? Certain calculators are primarily for African descent and running European DNA through them will give false African results. I see the last results you listed were from Ethiohelix K10 + French. Although that one is for mixed African and European DNA, even so, ANY Ethiohelix calculator is designed for people who have strong African ancestry - using those calculators is not going to give accurate results for someone who is primarily or entirely non-African. If you were using Ethiohelix for all these results, it is not surprising you have such strong African results, but it is not an accurate calculation for you.
ReplyDeleteFinally information that I can begin to understand. Long way to go though. Most grateful.
ReplyDeleteJames Sanderson
Many thanks for breaking this information down for us! Very helpful and much appreciated.
ReplyDeleteThank you!
ReplyDeleteAll the work you have done is outstanding...just wondering. We are Scottish Highlanders who know we have Viking ancestry. Can you lead us to where we should search for that in Gedmatch. Thank you very much.
ReplyDeleteNone of the admixture calculators at Gedmatch have a good divide between Scandinavia and British Isles. Some of the Eurogenes calculators have North Sea vs North Atlantic (or just Atlantic), but the latter largely includes mainland Western Europe too. There will be more specific populations in Oracle, of course, but there's no percentages with those. You can view my list of available admixture and Oracle populations here: https://docs.google.com/spreadsheets/d/e/2PACX-1vQyi9kkGOYOlKIKdoweLNTXNBXpYr_JpcBXUS5L2Yj-f5NE7GSoRJT-yRc-YWKbcK5XpmWH0Iv82Hcf/pubhtml
DeleteThank you so much for your response.
ReplyDeleteWhat is the difference between North Sea and North Atlantic in terms of what Countries are included?
ReplyDeleteThe only calculator that includes both North Sea and North Atlantic (versus just Atlantic) is Eurogenes K36, which unfortunately doesn't have a spreadsheet. However, there are unofficial maps available for it here: https://anthrogenica.com/showthread.php?10347-(Unofficial)-oracle-for-Eurogenes-K36-256-reference-populations - they cover much of the same areas, but North Atlantic is more weighted towards Ireland, Scotland, Wales, and England, whereas North Sea is weighted more towards Norway, Sweden, Denmark, and the Netherlands.
DeleteHello! :)
ReplyDeleteI was looking for explanations on how to use Gedmatch and found its great exposure. Please, can you clarify to me three specific results that I obtained using the calculators? Thank you very much for your attention.
- Sites results: https://drive.google.com/folderview?id=1Y17U_7WTUUfBNcresQEj7T8Ab3v9qTs3
1) https://drive.google.com/folderview?id=1rIWY7iIdXbAG3eINPsZiK001eFIGukGs
2)https://drive.google.com/folderview?id=1cSEyx3Fl0HT1UaoCYEKEnI1mjPKtov3v
3)https://drive.google.com/folderview?id=1Gi8eXNDB_7P_ku_9rsWPsXd0IKGYIN1U
I took the direct test for Myheritage and, like many people, I transferred my raw data to other sites. I noticed that MyHeritage did not specify Amerindian or Amazonian DNA. DNALand was more objective in this case. Myheritage "gave" me 1.7% of West Asia and did not include any specific place, since the DNALand "gave" me 1.4% Arab / Egyptian including Yemenite Jew in Yemen.
The FTDNA did not show me any of the above results. What most caught my attention in Gedmatch were Ashkenazim results. As far as I know, my father's grandfather owned a few lands and cattle rancher. On Saturday, neither he nor his employees worked, for the day was "holy." It is well known that in the area where I live, many crypto-Jews settled in, but, taking away my father's grandfather, I have no knowledge of Jewish ancestors in the family. On the maternal side I know little and I am not aware of any Jewish ancestors either.
I noticed that, Gedmatch, showed me "Lemba". By name, he concludes that it was somewhere in Africa. I went looking for it and got it: http://haruth.com/jw/JewishLemba.html
Taking into account the results of Jewish ancestry that I obtained with gedmatch, should I consider myself a Jewess - by DNA pathways - or are these results just a noise and mean absolutely nothing?
If the answer is yes, would it be correct to say that I am at least 50% Jewish or can not calculate the percentage for sure?
If the answer is no, if you have interest or curiosity, here are the results of the other three calculators that I used. The PuntDNAL K15 was the most "accurate".
1) https://drive.google.com/folderview?id=10lJtuiKsa4uH1Xjgl9CBAGCg6NBp3g7i
2) https://drive.google.com/folderview?id=13ddtdCjPMIs_at6OYF_Ydql879tCS-xh
3) https://drive.google.com/folderview?id=1hC4gMnHMNjS31mORWKJbKyITlcQcjlFH
I'm Brazilian.
I logged in just to thank the author. Excellent job!
ReplyDeleteOk, so I think I am understanding everything correctly. I am not 100% sure where my maternal grandmother is from as she was adopted and she does not know her background. Throughout all the tests, I ran MDLP World-22 and that is closest numbers I have found. However, I am not sure if that is the most accurate? Regardless, I am posting my results below. Any help would be greatly appreciated. This blog is amazing and has been very helpful. Thank you!!
ReplyDeleteAdmix Results (sorted):
# Population Percent
1 North-East-European 49.10
2 Atlantic_Mediterranean_Neolithic 33.57
3 West-Asian 7.53
4 North-European-Mesolithic 4.69
5 Near_East 3.45
6 Indo-Iranian 1.10
Finished reading population data. 276 populations found.
22 components mode.
--------------------------------
Least-squares method.
Using 1 population approximation:
1 German_V_derived @ 2.041193
2 Austrian_derived @ 3.194867
3 CEU_V_derived @ 3.323946
4 Hungarian_derived @ 5.318126
5 Welsh_derived @ 6.205633
6 CEU_derived @ 6.812555
7 Slovenian_derived @ 6.985820
8 German-North_derived @ 7.156721
9 Croatian_derived @ 7.227023
10 German_derived @ 7.562445
11 British_derived @ 7.719973
12 Bosnian_derived @ 8.086045
13 Swedish_derived @ 8.141460
14 Norwegian_V_derived @ 8.337689
15 German-South_derived @ 8.428369
16 Serbian_derived @ 8.592421
17 Orcadian_derived @ 9.038073
18 Czech_derived @ 10.926109
19 Swedish_V_derived @ 11.264226
20 Croatian_V_derived @ 11.398908
Using 2 populations approximation:
1 50% CEU_derived +50% Croatian_derived @ 1.422203
Using 3 populations approximation:
1 50% CEU_V_derived +25% Macedonian_derived +25% Swedish_derived @ 1.081146
Using 4 populations approximation:
++++++++++++++++++++++++++++++++++++++++++++++++++++++++++++++++++++++++++
1 CEU_V_derived + German_V_derived + Montenegrin_derived + Swedish_derived @ 0.885259
2 German-North_derived + German-South_derived + Serbian_derived + Swedish_derived @ 1.050507
3 CEU_V_derived + German_V_derived + Macedonian_derived + Swedish_derived @ 1.080140
4 CEU_V_derived + CEU_V_derived + Macedonian_derived + Swedish_derived @ 1.081146
5 German-South_derived + Kosovar_derived + Latvian_derived + Norwegian_V_derived @ 1.108209
6 British_derived + Croatian_derived + Montenegrin_derived + Swedish_V_derived @ 1.135735
7 German_V_derived + German_V_derived + Montenegrin_derived + Swedish_derived @ 1.143167
8 British_derived + Macedonian_derived + Slovenian_derived + Swedish_derived @ 1.169645
9 Estonian_derived + French_derived + German-North_derived + Kosovar_derived @ 1.169824
10 Bosnian_derived + CEU_V_derived + German-South_derived + Swedish_derived @ 1.173648
11 CEU_V_derived + CEU_V_derived + Montenegrin_derived + Swedish_derived @ 1.180137
12 Croatian_derived + Italian_North_derived + Swedish_derived + Swedish_derived @ 1.190564
13 British_derived + Croatian_derived + Serbian_derived + Swedish_derived @ 1.196998
14 German_V_derived + German_V_derived + Montenegrin_derived + Swedish_V_derived @ 1.203959
15 Bulgarian_derived + CEU_V_derived + CEU_V_derived + Swedish_derived @ 1.213158
16 German-South_derived + Provancestralal_derived + Swedish_derived + Ukrainian-Center_derived @ 1.213447
17 German-North_derived + German-South_derived + Montenegrin_derived + Swedish_V_derived @ 1.218839
18 Croatian_derived + German-North_derived + Italian_North_derived + Swedish_V_derived @ 1.224951
19 CEU_derived + Montenegrin_derived + Slovenian_derived + Swedish_derived @ 1.226958
20 British_derived + German-North_derived + German-North_derived + Macedonian_derived @ 1.227632
Done.
Hi there, my Eurogenes K13 Oracle Admix Results (sorted) show my 2nd largest DNA group as North Atlantic my question is, what parts of Europe "North Atlantic" is meant here ? And the 3rd largest DNA group is "West Med", what does it mean with "West Med"? and what about "East Med"? Thank you. Edward.
ReplyDeleteThere's some maps for Eurogenes K15 which are likely similar to the regions for K13: http://bga101.blogspot.com/2013/10/eurogenes-k15-now-at-gedmatch.html - But the best way to get an idea of what areas the categories cover is to use the Spreadsheet. It shows you the population samples and what percentage they get in each category. I like to copy and paste it into my own spreadsheet so I can then reorder it by column. Doing so, you can see these are the top populations which get the highest percentage in North Atlantic:
DeleteWest_Scottish 53.18
French_Basque 52.62
Irish 52.23
Southwest_English 51.98
Orcadian 51.33
Norwegian 51.14
Southeast_English 50.52
North_Dutch 50.44
Danish 50.04
Swedish 48.53
North_German 47.17
South_Dutch 44.59
North_Swedish 44.52
Spanish_Aragon 43.83
West_German 43.14
French 42.6
Southwest_French 42.35
Spanish_Cantabria 41.79
Spanish_Cataluna 41.36
Spanish_Castilla_La_Mancha 41.09
Spanish_Castilla_Y_Leon 40.76
Spanish_Valencia 40.54
Spanish_Murcia 40.15
Spanish_Andalucia 39.07
Portuguese 38.54
Spanish_Galicia 38.51
Spanish_Extremadura 38.27
East_German 37.34
Austrian 37.21
It is basically the British Isles, Scandinavia, Western (Germanic) Europe, and even Iberia. It's a very broad Northwest European category.
For Wed Mediterranean, there's only one population that gets the highest percentage in that category: Sardinian at 51.87%. The following is the next top 20 after that, but they actually get higher percentages in other categories (North Atlantic or East Med):
French_Basque 35.86
Southwest_French 30.54
Spanish_Aragon 29.79
Spanish_Cantabria 29.27
Spanish_Andalucia 29.07
Spanish_Castilla_La_Mancha 28.52
Spanish_Valencia 27.72
Spanish_Extremadura 26.84
Spanish_Galicia 26.23
Spanish_Murcia 26.12
Spanish_Castilla_Y_Leon 26.09
Spanish_Cataluna 25.78
North_Italian 25.76
Moroccan 25.34
Portuguese 25.32
Mozabite_Berber 24.17
Tuscan 23.79
Algerian_Jewish 22.86
South_Italian 22.77
West_Sicilian 22.7
So this category is strongly Sardinian but has a lot of overlap with North Atlantic and East Mediterranean. I'd probably say this most closely resembles the Iberian category at other DNA companies.
These are the top populations which get the highest percentage in East Mediterranean:
Yemenite_Jewish 52.36
Lebanese_Druze 48.65
Lebanese_Christian 47.26
Samaritan 45.52
Palestinian 43.55
Saudi 42.83
Iranian_Jewish 41.97
Kurdish_Jewish 41.89
Cyprian 41.08
Jordanian 40.75
Lebanese_Muslim 39.72
Tunisian_Jewish 39.64
Assyrian 39.64
Egyptian 39.56
Libyan_Jewish 38.94
Italian_Jewish 38.45
Bedouin 38.15
Syrian 37.83
Algerian_Jewish 37.03
Sephardic_Jewish 36.91
Georgian_Jewish 36.59
Armenian 34.79
Ashkenazi 34.61
South_Italian 31.82
Tunisian 30.54
East_Sicilian 29.91
Central_Greek 29.25
West_Sicilian 28.66
Algerian 28.26
Italian_Abruzzo 27.45
Mozabite_Berber 26.45
Moroccan 25.5
Greek_Thessaly 25.4
So this is part of the Middle East, Jewish, North Africa, Greece, and Italy. Basically, areas that border the Eastern Mediterranean Sea. Keep in mind that West Asia and Red Sea also cover parts of the Middle East.
Hope that helps!
I'm terribly confused by all of this oracle calculater. I'm turkish fellow from Turkey and I have known myself and my whole family either from my dad's or mom's side as turkish. We speak turkish, we are turkish and i can even say that we are proud of it.
ReplyDeleteHowever all of my oracle results state that I have armenian roots. Results are as follows:
Eurogenes K13 Oracle results:
Single Population Sharing:
1 Armenian 6.87
2 Georgian_Jewish 8.17
3 Kurdish 8.69
4 Iranian 11.69
5 Assyrian 11.87
6 Azeri 11.9
7 Georgian 13.01
8 Abhkasian 13.55
9 Turkish 14.04
10 Kurdish_Jewish 15.39
Eurogenes EUtest V2 K15 Oracle results:
Single Population Sharing:
1 Armenian 7.7
2 Georgian_Jewish 9.69
3 Kurdish 10.71
4 Iranian 13.16
5 Azeri 13.62
6 Assyrian 13.93
7 Georgian 13.93
8 Turkish 15.19
9 Abhkasian 16.62
10 Kumyk 16.91
MDLP K16 Modern Oracle results:
Single Population Sharing:
1 Georgian (Laz) 2.81
2 Adjar (Adjaria) 3.27
3 Georgian (Georgia) 3.28
4 Armenian (Armenia) 3.67
5 Georgian_Abkhazia (Abkhazia) 4.27
6 Georgian (Kakheti) 4.33
7 Armenian (Armenia) 4.66
8 Armenian (Vardnis) 4.93
9 Armenian (Vanatur_Hrazdan) 5.29
10 Armenian (Erzrum) 5.39
Here is the twist: my mother's side are from somewhere known with georgian population and my father's side are with armenian population however as I said above we have always known ourselves as turkish.
What do you think? Do these tests are 100% trustworthy? Does it mean that i am actually armenian & georgian because i now that anatolia is a complex territory and all the ethnicities mixed with each other. On the other hand i have seen other turkish people's results where they come up with turkish single population sharing results.
Could you help me to understand this oracle results? Thanks
I imagine that Armenia and Turkey have a lot of genetic overlap since they are right next to each other. All DNA ethnicity reports are estimates, they are definitely not 100% trustworthy, and it's not unusual to get results in neighboring regions of your known ancestry. Alternately, it could be that your roots actually go back to Armenia - sometimes, an ethnicity report can be more representative of about 1000 years ago (even the non-ancient ones), which predates what you know about your ancestry. Maybe your ancestors were originally from Armenia (and/or Georgia) before they went to Turkey.
DeleteThankyou, clear and concise .
ReplyDeleteThank you for your reply
ReplyDeleteMy single reference population is Portugal at 4.6 which is my understanding, close. It matches my paper trail but I dont look like the typical Portuguese
ReplyDeleteWhy? Are you blonde with blue eyes? Remember these are recessive traits, you can be portuguese genetically and be light. If you are dark that's normal too, sometimes extreme cases happen, someone can look more their "north sea" component and the other more their "west med" component.
DeleteExcellent Article THANK YOU !!
ReplyDeleteThank you!
ReplyDeleteCould someone please assist with my Dodecad Admixture result
ReplyDeletek12b.
What is a
LWk30,CHS30,CDX30
Thanking you in advance
Leticia
They are likely samples from archaeological digs, probably ancient or prehistoric. LWK30 seems to only get results in firstly Sub-Saharan and secondly East Africa. CHS30 and CDX30 both peak only in Southeast Asian and East Asian.
DeleteThanks for the blog on how to use admixture on GedMatch. My paper ancestry is 100% Irish on my paternal side and maternally mainly Scotch-Irish, some English and only one set of great grandparents parents of Germanic origin (1/8). Ancestry.com said 68% Irish and Scottish with 32% England, Wales and North Western Europe. Eurogenes K13 Oracle emphasized the Irish and Scottish with some Danish & Dutch. Oracle 4 was heavily Irish with 25% North German, higher than expected but okay. Eurogene K15 emphasized SE England and Danish over Ireland and Scotland. The oracle 4 results were suprising with 50% South_Dutch +50% West_Scottish, or 50% Danish +25% French_Basque +25% North_Swedish with Irish showing up only in a couple of the 4 population estimates. Therefore these estimates are very different, so be wary.
ReplyDeleteHello, where can I find a guide to the populations in Eurogenes K36? Tx.
ReplyDeleteThere is no real populations guide for any of the calculators, that's why I wrote this overall guide. The only details available are the links I provided for it.
DeleteHello, thanks for writing such valuable info! I'm a Latin American people that is mostly 50% Native American and the other 50% from Mediterranean Europe. I'm a bit confused since Myheritage shows my Native American being almost 60%, most of my European being Italian (with no Iberian at all) and some Scandinavian component, along with a bit Central Asia.
ReplyDeleteUsing Gedmatch I'm getting very different results, situating the Native American more at 35% , while the rest being different European groups.
In my case what calculator should I use to delve more into my European heritage? It seems rather odd to me that most of my European heritage is Italian and that no Iberian would appear. And by the way, if in some calculators it appears that I have 1% Sub-Saharan, does it actually that? or is it a false result?
Thank you for your amazing article . I still don't understand distance. If Oracle says the distance for a single population is 6 does that mean six generations back on my timeline for that particular population group? Thank you.
ReplyDeleteNo, the distance is not generations or a timeline, it's merely a numerical scale of how similar your DNA is to the population group.
DeleteHello! Please, how do i do to know how far i'm from each generetion of any ethnicity? For example, i have 25% of italian and 30% of iberian and 4% from irish, scotish and walles.. second My Heritage. when i use gedmatch, the calculator MDLP K23b 4-Ancestors Oracle, gives me the follow:
ReplyDeleteAdmix Results (sorted):
# Population Percent
1 European_Early_Farmers 23.72
2 Amerindian 14.46
3 European_Hunters_Gatherers 13.55
4 Subsaharian 11.99
5 Caucasian 11.25
6 North_African 8.31
7 South_Central_Asian 3.72
8 Archaic_African 3.41
9 Ancestral_Altaic 3.02
10 Near_East 2.61
11 African_Pygmy 2.54
Finished reading population data. 620 populations found.
23 components mode.
--------------------------------
Least-squares method.
Using 1 population approximation:
1 Puerto_Rican_ @ 5.213633
2 Colombian_ @ 15.592019
3 Mexican_CV_ @ 24.672218
4 Spanish_Canarias_IBS_ @ 26.080551
5 Miwok_ @ 26.235008
6 Portugese_ @ 26.308578
7 Tsimsian_ @ 27.150488
8 Spanish_Extremadura_IBS_ @ 28.227238
9 Mexican_ @ 28.433636
10 Spanish_Galicia_IBS_ @ 28.564209
11 Spanish_Castilla_y_Leon_IBS_ @ 28.960699
12 Spanish_Murcia_IBS_ @ 29.053242
13 Spanish_Baleares_IBS_ @ 29.252815
14 Italian_North_ @ 29.524698
15 Spaniard_ @ 29.606071
16 French_ @ 30.313633
17 Italian_Bergamo_ @ 30.391714
18 Spanish_Cataluna_IBS_ @ 30.598583
19 Spanish_Andalucia_IBS_ @ 30.730875
20 Italian_Piedmont_ @ 30.987936
Using 2 populations approximation:
1 50% Puerto_Rican_ +50% Puerto_Rican_ @ 5.213633
Using 3 populations approximation:
1 50% Puerto_Rican_ +25% Puerto_Rican_ +25% Puerto_Rican_ @ 5.213633
Using 4 populations approximation:
+++++++++++++++++++++++++++++++++++++++++++++++++++++++++++++++++++++++++++++++++++++++++++++++++++++++++++++++++++++++++++++++++++++++++++++++++++++++++++++++++++++++++++++++++++++++++++++++++++++++++++++++++++++++++++++++++++++++++++++++++++++++++++++++++++++++++++++++++++++++++++++++++++
1 Puerto_Rican_ + Puerto_Rican_ + Puerto_Rican_ + Puerto_Rican_ @ 5.213633
2 Afroamerican_ + Cochimi_ + Portugese_ + Spanish_Canarias_IBS_ @ 5.974385
3 Afroamerican_ + Portugese_ + Serrano_ + Spanish_Canarias_IBS_ @ 6.038254
4 Afroamerican_ + Cochimi_ + Portugese_ + Portugese_ @ 6.175093
5 Afroamerican_ + Chilote_ + Portugese_ + Spanish_Canarias_IBS_ @ 6.276498
6 Afroamerican_ + Serrano_ + Spanish_Canarias_IBS_ + Spanish_Canarias_IBS_ @ 6.281390
7 Afroamerican_ + Ojibwa_ + Spanish_Canarias_IBS_ + Spanish_Canarias_IBS_ @ 6.297385
8 Afroamerican_ + Serrano_ + Spanish_Canarias_IBS_ + Spanish_Extremadura_IBS_ @ 6.309112
9 Colombian_ + Puerto_Rican_ + Puerto_Rican_ + Puerto_Rican_ @ 6.325403
10 Afroamerican_ + Serrano_ + Spanish_Canarias_IBS_ + Spanish_Castilla_y_Leon_IBS_ @ 6.339272
11 Afroamerican_ + Cochimi_ + Spaniard_ + Spanish_Canarias_IBS_ @ 6.341543
12 Afroamerican_ + Cochimi_ + Spanish_Baleares_IBS_ + Spanish_Canarias_IBS_ @ 6.345510
13 Afroamerican_ + Ojibwa_ + Portugese_ + Spanish_Canarias_IBS_ @ 6.347891
14 Afroamerican_ + Cochimi_ + Spanish_Canarias_IBS_ + Spanish_Extremadura_IBS_ @ 6.359190
15 Afroamerican_ + Cochimi_ + Spanish_Canarias_IBS_ + Spanish_Castilla_y_Leon_IBS_ @ 6.360099
16 AA_Denver_ + Cochimi_ + Portugese_ + Spanish_Canarias_IBS_ @ 6.386978
17 AA_Denver_ + Portugese_ + Serrano_ + Spanish_Canarias_IBS_ @ 6.398850
18 Afroamerican_ + Cochimi_ + Portugese_ + Spanish_Castilla_y_Leon_IBS_ @ 6.422071
19 Afroamerican_ + Serrano_ + Spanish_Canarias_IBS_ + Spanish_Galicia_IBS_ @ 6.424261
20 Afroamerican_ + Cochimi_ + French_ + Spanish_Canarias_IBS_ @ 6.436290
so, how this results is trustly, if i have more precentual DNA European and calculator MDLP K23b 4-Ancestors Oracle, tells me that i'm most Puerto Rican than North Italian, for example??
Thanks in advance!
Henrique Regis.
What's the difference between Archiac Human and African? As far as I remember, those that contribute to our genes that are any way archaic (scientifically speaking) are Neanderthal and Denisova. No other ancient DNA has been found in human's gene pool. And there is no evidence of Homo erectus and other archaic and what would be termed "African" in any of the world population's dna. Just saying.
ReplyDeleteThose terms only seem to be used in MDLP K23b. You'd have to contact the project creator to get more info on the difference between them: http://magnusducatus.blogspot.com/
DeleteI did but got no response
ReplyDeleteI happen to know that I am half ashkenazi on my mothers side. I know that you said that one of the best calculators for that was the EUROGENES JTest. In the population you have to input before you pick the calculator I have been putting ashkenazi but the JTest calculator is never one of my options. Do you know if they removed it or if there is something else going on?
ReplyDeleteAlso, my dad is european mix, primarily france, germany, england, and scotch-irish. Going off of that and my ashkenazi mother, what would you recommend as a calculator?
Jtest is still available at Gedmatch. Make sure you're clicking on "Admixture (heritage)" not "Admixture / Oracle with Population Search". The select Eurogenes, and on the next page put in your kit number and select Jtest from the drop down list.
DeleteThat page was SO HELPFULL ! Thank you!
ReplyDeleteI saw in your "favorite" resources were Pittsburgh ones (and I saw one from Oakmont). Is that your hometown? I'm in Oakmont right now. :)
ReplyDeleteNo, I've never been to Pittsburgh, I'm originally from central PA and the Philadelphia area, but I have ancestors from Pittsburgh. I hope my resources are useful to you!
DeleteWow! Thank you. This is now on my Favorites Bar for reference.
ReplyDeleteThanks for sharing an in-depth article on Gedmatch. Thought will share few more insights on Gedmatch in this blog.
ReplyDeleteThank you for a great, informative guide to using admixture and oracle calculators. I would like to mention it on the “newspage” of my site, ( yourDNAportal ) as we have similar calculators and our members would benefit from your insights. Kind Regards, Gemma Kate Rooney
ReplyDeleteHello, this guide has been very helpful. However, something is bugging me regarding my known ancestry as compared to test results. About 90% of my family tree is from England, Scotland, Ireland, or Wales, which shows up roughly accurately in FTdna tests and Myheritage. The rest should be german and dutch. Given my known ancestry, the fact that a single population sharing would be most similar to south dutch makes sense. However, what does not make sense in any DNA tests of mine or my fathers is a strong signal for southern and/or eastern europe. I have no known ancestry from these areas, at least not that was written down. I assumed it could have just been trace results from south german populations, but the gedmatch oracle results all point to some ancestor at some point having dna from spain or italy or wherever.
ReplyDeleteHow is this possible when I match people in the family who supposedly have the same roughly 90% english/ 10% german ancestors? I have some unusual features for a completely northern european mix, but for me these tests just do not explain the strange admixture results. I have both blonde hair and blue eyes, and pigmentation is not strong. But some facial features mean you could suspect something else in there. I just don't know what. There's nothing in my family tree that explains the bizarre DNA results of myself and my father.
i am african american and i uploaded my RAW DNA from Ancestry. what calculator should i use if i want to use GEDMatch for my research? I dont want to just know the African ancestry, but everything else. i have been using MDLP 22 - ORACLE 4 but i don't know if that is accurate
ReplyDeleteYeah, MDLP 22 is ideal for mixed ancestry, but as always, Oracle 4 is ideal for someone with each grandparent from a single, different population. If that's not the case, Oracle may not have very accurate results.
Delete